
Estimation of the Nutritional Values of African Locust Bean Parkia biglobosa
-
Oguazu Chinenye Enoch


Department of Applied Biochemistry, Faculty of Biosciences, Nnamdi Azikiwe University, Awka, Nigeria
Lilian Isioma ChigozieDepartment of Applied Biochemistry, Faculty of Biosciences, Nnamdi Azikiwe University, Awka, Nigeria
Spencer Chukwumaobim NwangwuDepartment of Biochemistry, College of Natural and Applied Sciences, Igbinedion University, Okada, Nigeria
Chinwe Gloria IbeabuchiAfrica Center of Excellence in Public Health and Toxicological Research, University of Port Harcourt, Rivers State, Nigeria
Ubaoji Kingsley IkechukwuDepartment of Applied Biochemistry, Faculty of Biosciences, Nnamdi Azikiwe University, Awka, Nigeria
Anyanwu Reginald OgochukwuDepartment of Applied Biochemistry, Faculty of Biosciences, Nnamdi Azikiwe University, Awka, Nigeria
Ezeanyanwu Valentine ChukwuebukaDepartment of Science Laboratory Technology, Faculty of Applied Sciences, Imo State Polytechnic Omuma, Imo State, Nigeria
Anyaoha Ihedinachi VictoriaDepartment of Applied Microbiology and Brewery, Faculty of Biosciences, Nnamdi Azikiwe University, Awka, Nigeria
Ajakpofo Firstina OruaroDepartment of Applied Biochemistry, Faculty of Biosciences, Nnamdi Azikiwe University, Awka, Nigeria
| Received 12 May, 2024 |
Accepted 16 Jan, 2025 |
Published 17 Jan, 2025 |
Background and Objective: The African locust bean is a leguminous plant native to the African continent, cultivated and consumed for its nutritional and economic significance. The fermented seeds have been traditionally used as a food ingredient in many African cuisines. This study aimed to investigate the nutritional value of the African locust bean. Materials and Methods: The proximate analysis was carried out by the method described by the Association of Official Analytical Chemistry, Official Methods, partial oil characterization, antioxidant activity, vitamins, and minerals in the African locust bean Parkia biglobosa were determined using standard spectrophotometric methods. Results: The result showed a moisture content of 7.5%, protein 3.07%, fat 27%, crude fibre of 27%, ash 5.5%, and carbohydrate of 39.43%. The result showed superoxide scavenging activity at 60.225%, ABTS 50.4%, Hydroxyl radical 54.5%, and Nitric oxide 3.1%. Further investigation found that the African locust bean contains a high concentration of vitamins and minerals. The partial oil characterization results show as follows: Saponification value (183.73±1.00), peroxide value (7.65±0.200), iodine value (42.69±0.61), refractive index (1.06±0.0005), acid value (8.12±1.11), free fatty acids (5.41±0.56), viscosity (156.45±2.11), specific gravity (0.93±1.36), cloud point (10.43±0.15°C), flashpoint (294±2°C), melting and boiling point (324.7±0.51; 6.47±0.31°C). Conclusion: The findings suggest that the African locust bean is a good source of antioxidants and these dietary components are essential for promoting growth, reducing malnutrition, and improving overall health.
INTRODUCTION
African locust bean (Parkia spp.) is a gram leguminous tree species native to the African Continent. Depending on the location, it is known as iru (Yoruba), dawadawa or ogiri (Igbo), néré or dawadawa (Hausa). The tree may grow to heights of up to 20 m and is found throughout West, Central, and East Africa1.
African locust bean is highly regarded for its numerous uses in traditional African food, medicine, and rural economies. It is nutrient-dense and has a distinct flavor profile highlighted by a strong, pungent scent. They are used to flavor soups and stews2.
African locust bean also has therapeutic qualities ascribed to its bioactive compounds. These compounds have been reported to possess antimicrobial, antioxidant, and anti-inflammatory activities. The seeds of African locust beans are typically extracted from the pods through manual or mechanical means. They then undergo fermentation processes1 which is a crucial stage in the preparation process. Fermentation reduces the natural toxins in the raw seeds, improves their flavor, and enhances their nutritional characteristics. Once fermented, African locust bean seeds can be used in a wide range of dishes. They are commonly utilized as a flavoring agent and food condiment in traditional African cuisine they are a good source of protein, carbohydrates, and fiber. They also contain several vitamins and minerals, including calcium, iron, and zinc. These nutritional components make African locust bean seeds a valuable addition to diets, especially in regions where protein and micronutrient deficiencies are prevalent.
Locust beans have been used for centuries in traditional medicine to treat a variety of conditions3 including anemia, constipation, diarrhea, and fever. The economic importance of the African locust bean cannot be overstated. It plays a vital role in the livelihoods of rural populations, particularly as a source of revenue. Its processing and trading create employment opportunities and contribute to local economies. Furthermore, the tree has nonfood uses, such as its timber being utilized for construction and its leaves being used as fodder for cattle4.
Overall, the African locust bean is a culturally significant and economically valuable resource in Africa. Its nutritional richness, diverse uses, and potential for sustainable development make it an intriguing subject for further research, innovation, and conservation efforts5. This study aimed to analyze the nutritional values and components of the African locust bean Parkia biglobosa.
MATERIALS AND METHODS
Study area: The study was carried out at the Department of Biochemistry, Department of Biochemistry, Research Laboratory, Faculty of Natural and Applied Sciences, Nnamdi Azikiwe University, Awka, Nigeria, from April to May, 2023. The Biochemistry Laboratory conducted the proximate analysis research, while Docchy Analytical Laboratories and Environment Services Limited, Awka, Nigeria conducted the physiochemical, mineral, and vitamin composition analysis.
Sample collection and preparation: The Parkia biglobosa seeds (1.5 kg) were purchased from the Eke Awka market, Awka. Nigeria. The African locust bean seed was selected carefully to remove every dirt. Thereafter, it was dehulled using a mortar and pestle. It was then sun-dried, collected, and ground into a powder with the aid of an electrical blender. The samples were stored in an airtight container for laboratory analysis after being sieved to produce fine powders of the samples.
Proximate analysis
Moisture content determination: An empty crucible was dried in an oven (Microsil, India) for about 10 min and allowed to cool in a desiccator containing calcium chloride for about 20 min and then weighed (W1). Five grams of the sample was weighed into the Petri dish (W2) and placed in an oven at 105°C. It was then brought out, cooled in a desiccator, and weighed (W3). The procedure was repeated until a constant weight is obtained6:
Ash determination: Ash represents the inorganic remains after the organic carbonaceous portion and other volatile components have been oxidized and evaporated away. An empty crucible was fire-polished in a muffle furnace and allowed to cool in a desiccator containing calcium chloride for 20 min and then weighed (W1). The samples (2 g each) were weighed into separate crucibles (W2) transferred into a muffle furnace and heated at 550°C until the sample was completely ashed, the crucible was removed and a drop of water was added to expose the unashed portion. The crucible was placed back in the muffle furnace and heated for 30 min more. This was removed and allowed to cool in a desiccator after which the crucible with the ash was weighed (W3)6:
Crude protein determination: The crude protein content of the samples was determined using the Microkjeldahl method of AOAC6. The samples were digested with concentrated sulphuric acid, using copper sulfate and sodium sulfate as the catalyst to convert organic nitrogen to ammonium ions. Alkali was added and the liberated ammonia was distilled into an excess boric acid. The distillate was titrated with hydrochloric acid or sulphuric acid.
One gram of the sample was weighed and transferred into the Kjeldahl digestion flask followed by the addition of 3 g of a mixture of sodium sulfate and copper sulfate pentahydrate in the ratio 10:1 as a catalyst. Four anti-bumping chips were added to prevent sticking of the mixture to the flask during digestion and also to enhance boiling. The Kjeldahl flask content was digested with 25 mL concentrated H2SO4. The flask was inclined and heated gently at first until frothing ceased, then heated strongly with shakings, at intervals, to wash down charred particles from the sides of the flask. Heating was continued until the mixture became clear and free from brown or black color. This was allowed to cool and the content of the flask made up to 100 mL using distilled water. About 20 mL of this diluted digest was placed in the distillation flask. About 20 mL of 2% boric acid solution was measured in a conical flask, and a few drops of screened methyl red indicator were added into the conical flask. The conical flask and its content were placed on the receiver so that the end of the delivery tube dips just below the level of the acid. A few pieces of granulated zinc and anti-bumping granules were added to the distillation flask and about 40 mL of 40% NaOH solution was run into the flask to make the liquid in the flask alkaline. The content was boiled vigorously until the content of the flask bumped. The distillate was titrated with 0.1 N HCl to a purple-colored endpoint (V/mL)6:
Crude protein (%) = Nitrogen (%)×6.25 |
Crude fat determination: The crude fat was determined using the Soxhlet extraction method of AOAC6. A 250 mL fit round bottom flask was washed and dried in an oven for about 25 min and allowed to cool in a desiccator before it was weighed (W1). Five grams of the sample was weighed (W) and wrapped in a thimble. This thimble and its content were inserted into the extraction column with the condenser. About 350 mL of the extracting solvent (n-hexane) was poured into the round bottom flask and fitted into the extraction unit. The flask was heated with the aid of an electrothermal heater at 60°C. Losses of solvent due to heating were checked with the aid of the condenser so that it cooled and refluxed the evaporated solvent. After extraction, the thimble was removed and the solvent was salvaged by distillation. The flask and its content were placed in a water bath to evaporate off the solvent. The flask and the residue were transferred to an oven and heated for some minutes to evaporate the remaining solvent and moisture to complete dryness. It was cooled in a desiccator and weighed (W2)6:
Crude fiber determination: The crude fiber was determined using the gravimetric methods as described AOAC6. The crude fiber method gives an estimation of insoluble and indigestible food residue which remains after which the sample has been treated under prescribed conditions. It was determined by consecutive treatment with light petroleum, boiling dilute sulphuric acid, boiling dilute NaOH, dilute HCl, alcohol, and ether. The insoluble residue was collected by filtration, dried, weighed, and ashed to collect mineral contamination.
Two grams of the defatted sample obtained during fat determination was air dried and transferred into a 250 mL conical flask. About 200 mL of 1.25% sulphuric acid was added and heated gently for 30 min. The flask was rotated every few minutes, to mix the content and remove particles from the side. At the end of the 30 min boiling period, the acid mixture was allowed to stand for 1 min and then filtered using filter paper. The filtration was fast and was completed within 2 min. The insoluble matter was washed with boiling distilled water until the filtrate is free from acid. The insoluble matter was washed back into the flask employing a wash bottle containing 1.25% NaOH and boiled for 30 min with the same precautions as those used in the early acid treatment. At the end of the 30 min of boiling, the mixture was allowed to stand for one minute and then filtered immediately using a filter paper. The insoluble matter was washed with boiling water until no base was detected in the filtrate. The whole insoluble matter was washed with 1% HCl and finally with boiling water until free from acid, it was then washed twice with alcohol and three times with ether. The insoluble matter was transferred into a dried weighed crucible and then oven-dried at 100°C to constant weight. The crucible and its contents in a muffle furnace at 550°C and re-weighed. The difference between the weight of ash and the weight of insoluble matter gave the weight of the crude fiber6:
 |
Determination of total carbohydrate: The total percentage carbohydrate content was determined by a difference of 100 as reported by Yerima and Adam7:
Total carbohydrate (%) = 100-(Moisture+Ash+Crude fibre+Crude protein+Fat) |
Anti-oxidants activity assay
ABTS scavenging effects: The antioxidant effect of the leaf samples was studied using the leaf extracts. It was also studied using ABTS (2,2-azino-bis-3-ethyl benzothiazole-6-sulphonic acid) radical cation decolorization assay according to the method of Shirwaikar et al.8.
The ABTS radical cations (ABTS+) were produced by reacting ABTS solution (7 Mm) with 2.45 Mm ammonium persulfate. The mixture was allowed to stand in the dark at room temperature for about 12-16 hrs before use. Aliquots (0.5 mL) of the different samples were added to 0.3 mL of ABTS solution and the final volume was made up to 1mL with ethanol. The absorbance was read at 745 nm in a spectrophotometer (Genesys 10-S, USA), and the percent inhibition was calculated using the formula:
Hydrogen peroxide scavenging effects: The ability of the leaf samples to scavenge hydrogen peroxide was assessed using the reagents. Phosphate buffer (0.1 M, Ph 7.4) and H2O2 (40 Mm) in phosphate buffer. A solution of H2O2 (40 Mm) was prepared in phosphate buffer. Leaf samples at the concentration of 10 mg/10 μL were added to the H2O2 solution (0.6 mL) and the total volume was made up to 3 mL. The absorbance of the reaction mixture was recorded at 230 nm in a spectrophotometer (Genesys 10-S, USA).
A blank solution containing phosphate buffer, without H2O2 was prepared8:
Where:
| A0 | = | Absorbance of control | |
| A1 | = | Absorbance in the presence of sample |
Superoxide scavenging activity: The superoxide scavenging ability of the samples was assessed by the method of Pavithra and Vadivukkarasi9. The principle of this assay is based on the inhibition of the production of nitro-blue tetrazolium formazan of the superoxide ion by the sample samples and is measured with a spectrophotometer at 560 nm. Reagents used are EDTA (0.1M containing 1.5 mg of NaCn), Nitro blue tetrazolium (NBT-1.5 Mm), riboflavin (0.12 Mm), and phosphate buffer (0.067 M, Ph 7.6). Superoxide anions were generated in samples that contained 3.0 mL, 0.02 mL of the samples (20 mg), 0.2 mL of EDTA, 0.1 mL of NBT, 0.05 mL of riboflavin, and 2.64 mL of phosphate buffer. The control tubes were also set up where DMSO was added instead of the sample samples. All the tubes were vortexed and the initial optical density was measured at 560 nm in a spectrophotometer (Genesys, 10-S, UV). The tubes were illuminated using a fluorescent lamp for 30 min. The absorbance was measured again at 560 nm. The difference in absorbance before and after illumination was indicative of superoxide anion scavenging activity.
Nitric oxide scavenging activity: The extent of inhibition of nitric oxide radical generation in vitro following the method reported by Green et al.10. Sodium nitroprusside in aqueous solution, at physiological PH, spontaneously generates nitric oxide, which interacts with oxygen to produce nitrite ions that are estimated with a spectrophotometer at 546 nm. The reagents used were sodium nitroprusside (100 Mm), phosphate buffered saline (PH 7.4), griess reagent 1%, sulphanilamide, 2% H3PO4, and 0.1% naphthylethylene diamine dihydrochloride.
The reaction was initiated by adding 2.0 mL of sodium nitroprusside, 0.5 mL of PBS, 0.5 mL of leaf samples (50 mg) and incubating at 25°C for 30 min. Griess reagent (0.5 mL) was added and incubated for another 30 min. Control tubes were prepared without the samples. The absorbance was read at 546 nm against the reagent blank, in a spectrophotometer (Genesys 10-S, USA).
Hydroxyl radical scavenging activity: The extent of hydroxyl radical scavenging from the Fenton reaction was quantified using 2-deoxyribose oxidative degradation as described by Kunchandy and Rao11.
The principle of the assay is the quantification of the 2’-deoxyribose degradation products, malondialdehyde, by its condensation with thiobarbituric acid. Reagents used are Deoxyribose (2.8 Mm), Ferric chloride (0.1 Mm), EDTA (0.1 Mm), H2O2 (1 Mm), Ascorbate (0.1 Mm), KH2PO4KOH buffer (20 Mm, Ph 7.4), Thiobarbituric acid (1%).
The reaction mixture contained 0.1 mL of deoxyribose, 0.1 mL of FeCl3, 0.1 mL of EDTA, 0.1 mL of H2O2, 0.1 mL of ascorbate, 0.1 mL of KH2PO4KOH buffer and 20 g of samples in a final volume of 1.0 mL. The mixture was incubated at 37°C for 1 hr. At the end of the incubation period, 1.0 mL of TBA was added and heated at 95°C for 20 min to develop the color. After cooling, the TBA formation was measured with a spectrophotometer (Genesys 10-S, UV) at 532 nm against an appropriate blank.
Determination of vitamins
Determination of Vitamin A: The Vitamin A was estimated using the principle that the assay is based on the spectrophotometric estimation of the color produced by Vitamin A acetate or palmitate with TCA by
Thakur et al.12. Reagents used were a saponification mixture (2N KOH in 90% alcohol), petroleum ether (40-60°C), anhydrous sodium sulfate, chloroform, vitamin A palmitate, and TCA reagent (60% TCA in chloroform)-prepared fresh.
All procedures were carried out in the dark to avoid the interference of light. About 1 g of sample was mixed with 1.0 mL of saponification mixture and refluxed for 20 min at 60°C in the dark. The tubes were cooled and 20 mL of water was added and mixed well. Vitamin A was extracted twice with 10 mL of (40-60°C) petroleum ether. The two samples were pooled and washed thoroughly with water. Anhydrous sodium sulfate was added to remove excess moisture. An aliquot of the sample (1.0 mL) was taken and evaporated to dryness at 60°C. The residue was dissolved in 1.0 mL chloroform. Standards (Vitamin A palmitate) of concentrations ranging from 0-7.5 g were pipetted out into a series of test tubes. The volume in all the tubes was made up to 1.0 mL with chloroform. TCA reagent (2.0 mL) was added rapidly, mixed and the absorbance was read immediately at 620 nm in a spectrophotometer (Genesys 10 UV). The same procedure was repeated for the sample tubes. Vitamin A content was expressed as mg/kg.
Determination of Vitamin E: The Vitamin E was estimated in the samples by the Emmerie-Engel reaction as reported by Thakur et al.12. The Emmerie-Engel reaction is based on the reduction of ferric to ferrous ions by Vitamin E, which with 2, 2-dipyridyl, forms a red color. Vitamin E and carotenes are first sampled with xylene and read at 460 nm to measure carotenes. A correction is made for these after adding ferric chloride and reading at 520 nm. Reagents used are absolute alcohol, Xylene, 2, 2’dipyridyl (1.2 g/L in n-propanol), ferric chloride solution (1.2 g/L in ethanol), standard solution (D, L-α-Vitamin E and 10 mg/L in absolute alcohol and sulphuric acid (0.1 N).
Extraction of Vitamin E: The sample (2.5 g) was homogenized in 50 mL of 0.1 N sulphuric acid and allowed to stand overnight. The contents of the flask were shaken vigorously and filtered through the Whatman No.1 filter paper. Aliquots of the filtrate were used for the estimation.
Then into three stoppered centrifuge tubes, 1.5 mL of sample, 1.5 mL of the standard, and 1.5 mL of water were pipetted out separately. To all the tubes, 1.5 mL of ethanol and 1.5 mL of xylene were added, mixed well, and centrifuged. The xylene (1.0 mL) layer was transferred into another stoppered tube. To each tube, 1.0 mL of dipyridyl reagent was added and mixed well. The mixture (1.5 mL) was pipetted out into a cuvette and the extinction was read at 460 nm.
Determination of Vitamin C: The Vitamin C was analyzed by the spectrophotometric method12 whereby, Ascorbate was converted into dehydroascorbate on treatment with activated charcoal, which reacts with 2,4-dinitrophenyl hydrazine to form osazones. These osazones produce an orange-colored solution when dissolved in sulfuric acid, whose absorbance can be measured spectrophotometrically at 540 nm reagents used are TCA (4%), 2,4 dinitrophenyl hydrazine reagent (2%) in 9 N H2SO4, thiourea (10%), sulfuric acid (85%), standard ascorbic solution: 100 μg/mL in 4% TCA.
Ascorbate was extracted from 1 g of the sample using 4% TCA and the volume was made up to 10 mL with the same. The supernatant obtained after centrifuging at 2000 rpm for 10 min was treated with a pinch of activated charcoal, shaken vigorously using a cyclomixer, and kept for 5 min. The charcoal particles were removed by centrifugation and aliquots were used for the estimation. Standard ascorbate ranging between 0.2-1.0 and 0.5 and 1.0 mL of the supernatant were taken. The volume was made up to 2.0 mL with 4% TCA. The DNPH reagent (0.5 mL) was added to all the tubes, followed by 2 drops of 10% thiourea solution. The contents were mixed and incubated at 370°C for 3 hrs resulting in the formation of osazone crystals. The crystals were dissolved in 2.5 mL of 85% sulfuric acid, in cold. To the blank, DNPH reagent and thiourea were added after the addition of sulfuric acid. The tubes were cooled in ice and the absorbance was read at 540 nm in a spectrophotometer.
Determination of Vitamin B1 and B2: After 1 g of the sample was weighed into a conical flask, it was dissolved with 100 mL of deionized water, shaken thoroughly heated for 5 min and allowed to cool and filtered. The filtrate was poured into the cuvette and their respective wavelength for the vitamins was set to read the absorbance using a spectrophotometer. They were read at Vitamin B1, 261 nm, and Vitamin B2 at 242 nm12:
Where:
| A | = | Absorbance | |
| E | = | Extinction coefficient = 25 for B1 and B2 | |
| DF | = | Dilution factor |
Determination of Vitamin B3 (Nicotinamide): Five gram of the sample were dissolved in 20 mL of anhydrous glacial acetic acid and warmed slightly, 5 mL of acetic anhydride were added and mixed. About 2-3 drops of crystal violet solution were added as the indicator, and titrated with 0.1 M perchloric acid to a greenish-blue colour6:
Determination of Vitamin B6: After 5 g of sample was dissolved in a mixture of 5 mL of anhydrous glacial acetic acid and 6 mL of 0.1 m mercury II acetate solution, two drops of crystal violet were added as the indicator and titrated with 0.1 m perchloric acid to a green color endpoint6.
Where, each mL of 0.1 M perchloric acid is equivalent to 0.02056 g of C8H11NO3HCL.
Determination of Vitamin B12: Spectrophotometric determination12 of cyanocobalamin in serum preparations by coupling reactions with pyridine.
The sample is prepared by weighing the equivalent of 0.1 mL of the sample into the separator. In the separator, 5 mL of water was added, mixed thoroughly, and extracted with 5 mL chloroform. The water layer was discarded and then taken through chloroform in a dry 50 mL volumetric flask and passed through anhydrous sodium sulfate which was then made up to 50 mL with chloroform.
Then 2 mL sample and blank solution were taken into the test tube. In each test tube, 2 mL of 0.2% solution of phenylhydrazine (in hydrochloric acid and alcohol in a ratio of 1:5 v/v) was added and mixed well. After that heat on a water bath until almost dry and cooled at room temperature. 2mL solution mixture (ammonia and alcohol in the ratio of 1:1) and 1 mL pyridine were added in each test tube. Its absorbance was recorded at 635 nm against blank. Standard cobalamin was also analyzed and treated the same as the sample.
The calibration curve was plotted and the concentration of the sample was extrapolated12.
Determination of Vitamin D: The principle is based on the formation of a yellow color by the reaction of the vitamin with a chloroform solution of trichloroacetic acid6. Standard preparation involves weighing accurately 25 mg of Vitamin D working standard was taken 25 mL. A volumetric flask with a solution mixture (chloroform and methanol in ratio 1:9) was then dissolved and diluted with the solution mixture
made up to the mark and properly mixed. The sample was prepared by weighing it accurately. equivalent 0.1 mL sample was taken 25 mL volumetric flask with solution mixture (chloroform and methanol in ratio 1:9) dissolved and diluted with solution mixture and made up to the mark and properly mixed. About 1.6 mL of 0.25N HCL, 0.5mL of 15.0% trichloroacetic acid (TCA), and 0.5 mL of 0.375% of thiobarbituric acid (TBA) was added and absorbance was recorded at 464 nm against blank6.
Partial oil characterization
Determination of acid value: After 25 mL diethyl ether was mixed with 25 mL alcohol and 1 mL phenolphthalein (1%) and carefully neutralized with 0.1 M, NaOH. It was dissolved with 1-10 g of the oil or melted fat in the mixed neutral solvent and titrated with aqueous 0.1 M of NaOH shaking constantly until pink color which persisted for 15 sec was obtained6:
The FFA figure is usually calculated as oleic acid (1 mL 0.1 M sodium hydroxide = 0.0282 g oleic acid), in which case the acid value = 2× FFA. For most oils acidity begins to be noticeable in the palate when the FFA calculated as oleic acid is about 0.5-1.5%, for palm oil as palmic (1mL 0.1 M NaOH = 0.0256 g), palm kernel, coconut, and similar lauric acid (1 mL 0.1 M NaOH = 0.0200 g).
Determination of iodine value: The oil was poured into a small beaker, and a small rod was added. A suitable quantity of the sample was weighed out into a dry glass-stoppered bottle of about 250 mL capacity. The approximate weight in g of the oil to be taken was calculated by dividing 20 by the highest expected iodine value6.
Then 10 mL of carbon tetrachloride was added to the oil or melted fat and dissolved and 20 mL of wijs’ solution was also added, a stopper was inserted (previously moistened with potassium iodine solution) and allowed to stand in the dark for 30 min). Then 15 mL of potassium iodine solution (10%) and 100 mL water were added, mixed, and titrated with 0.1 M thiosulphate solution using starch as indicator just before the end-point (titration = a mL). Carrying out a blank at the same time commencing with 10 mL of carbon tetrachloride (titration = b mL)6:
if (b-a) is greater than b/2 the test must be repeated using a smaller amount of the sample. It should be noted also that the less unsaturated fats with low iodine values are solid at room temperature.
Determination of peroxide value: Five gram test samples were weighed into the 250 mL flask, 30 mL of the acetic acid-chloroform solution was added and the flask swirled until the sample was dissolved in the solution. Then 0.5 mL of saturated potassium iodide was added with a graduated pipette. The solution was swirled for 1 min and then 30 mL of distilled water was added. It was then titrated with 0.01 N sodium thiosulphate solution, by adding it gradually and with constant and vigorous shaking until the yellow iodine color had almost disappeared. Then 0.5 mL of starch indicator was added. The addition of the thiosulphate solution dropwise continued until a blue color just disappeared. The blank test was carried out in parallel with the determination.
The peroxide value expressed in mill equivalents of active oxygen per kilogram of sample is6:
Where:
| Vs | = | Volume in milliliters of the sodium thiosulphate solution of normality N, used for the determination | |
| Vb | = | Volume in milliliters of the sodium thiosulphate solution used for the blank test | |
| W | = | Weight in grams of the test portion | |
| N | = | Normality of the sodium thiosulphate solution |
Determination of saponification value: After 2 g of the test portion was weighed into a conical flask, 25 mL of the ethanol potassium hydroxide solution and some boiling aids were added. The reflux condenser was connected and the mixture boiled gently for at least 60 min, swirling the contents of the flask from time to time. The flask and condenser were allowed to cool slightly before washing the inside of the condenser with a little distilled water. Then 1 mL of phenolphthalein solution was added and then titrated with the 0.5 N hydrochloric acid until the pink color of the indicator disappeared. A blank determination was conducted simultaneously using the same procedure6:
Where:
| Vb | = | Volume in milliliters of the hydrochloric acid solution used for the blank | |
| Vs | = | Volume in milliliters of the hydrochloric acid for the determination of the sample | |
| N | = | Normality of the hydrochloric acid | |
| W | = | Weight, in grams of the test portion |
Determination of the specific gravity of the oil: The density bottle was used to calculate the oil’s specific gravity. A 25 mL bottle with a clean, dry stopper was weighed (W0), then filled with oil, and reweighed to determine (W1).
After cleaning and drying the bottle, the oil was replaced with distilled water, and the result was weighed to produce (W2)6.
The specific gravity was calculated as:
 |
Where:
| W0 | = | Weight of dry empty density bottle | |
| W1 | = | Weight of density bottle+oil | |
| W2 | = | Weight of density bottle+distilled water |
Determination of fatty acids composition: The fatty acid composition of the oil sample was determined by the GC-MS method as described in AOAC6. One gram of oil was weighed and transferred to a Teflon test tube. Then 1 mL of 0.5 M methanolic KOH was then added to the oil sample. The mixture was refluxed for 90 min, allowing the oil globules to dissolve.
The cooled mixture was then treated with 2 M sulfuric acid to release the fatty acids. The liberated fatty acids were esterified for 20 min while boiling in the presence of a catalytic amount of methanolic BF3 (10 mL). After cooling, hexane was used to extract the esterified mixture. Water was used to clean and dry different hexane layers over anhydrous sodium sulfate.
By using GC/MS analysis, the methyl ester's fatty acid composition was identified. A gas chromatograph with an HP column, an auxiliary thermal detector, and helium as the carrier gas (Make: Agilent 19091S-433 UI). The operating conditions were; ovum temperature 325°C, column temperature 150°C, automatic sampler injector, injector volume 123, injector temperature 200°C, constant flow, 250°C inlet temperature, 10 psi pressure, and 50-550 scan mass range.
Determination of refractive index: The Abbe refractometer (Reichert AR 200 model, USA) was reset with a light compensator, the oil sample was seared on the lower prism of the instrument and closed, and light passed using the bangled mirror, and the reflected light appeared in the form of a dark background. Using the fine adjustment, the telescope tubes were moved until the lack of shadow appeared central in the cross-wire indicator and the refractive index smoke, flash, and fire point were read off. Then 10 mL volume of the oil was poured into an evaporating dish. A thermometer was suspended at the centre of the dish ensuring that the bulb just dips inside the oil without touching the bottom of the dish. The temperature of the oil was gradually raised using a hot plate (Thermoscientific, USA), and the temperature at which the oil sample gave off a thin bluish smoke continuously was noted as the smoke point. Similarly, the temperature at which the oil started flashing without supporting combustion was equally noted as the flash point. The temperature at which the oil starts supporting combustion was recorded as the fire point6.
Methods for the elemental analysis: Heavy metal analysis was conducted using Agilent FS240AA Atomic Absorption Spectrophotometer. The atomic absorption spectrometer’s working principle is based on the sample being aspirated into the flame and atomized when the AAS’s light beam is directed through the flame into the monochromator, and onto the detector that measures the amount of light absorbed by the atomized element in the flame. Since metals have their characteristic absorption wavelength, a source lamp composed of that element is used, making the method relatively free from spectral radiational interferences. The amount of energy of the characteristic wavelength absorbed in the flame is proportional to the concentration of the element in the sample. The sample was digested by weighing out approximately 2 g of the dried sample into a digestion flask and adding 20 mL of the acid mixture (650 mL concentrated HNO3; 80 mL perchloric acid; 20 mL conc. H2SO4), then the flask was heated until a clear digest was obtained and diluted the digested with distilled water to the 100 mL mark6.
A series of standard metal solutions in the optimum concentration range were prepared, and the reference solutions were prepared daily by diluting the single stock element solutions with water containing 1.5 mL concentrated nitric acid/liter. A calibration blank was prepared using all the reagents except for the metal stock solutions6.
RESULTS
Proximate analysis: The results of the proximate analysis of Parkia biglobosa are presented in Table 1. It shows that carbohydrate has the highest nutritive constituents percentage compared to other composition present.
Antioxidant assay
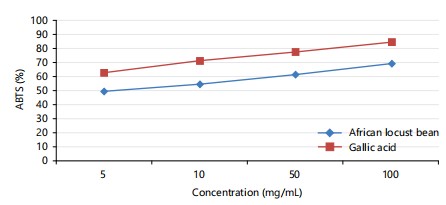
ABTS: The graph of the ABTS antioxidant activity of Parkia biglobosa extract compared to the ABTS antioxidant activity of the gallic acid shows that the African locust bean extract had higher ABTS activity than the gallic acid in Fig. 1. This exposes the locust bean as a potent antioxidant.
|
| Table 1: | Proximate composition of Parkia biglobosa | |||
| Parameter | Composition (%) |
| Moisture | 7.5±0.009 |
| Ash | 5.5±0.007 |
| Crude fat | 27±0.14 |
| Crude protein | 3.07±0.004 |
| Fiber | 17.5±0.08 |
| Total carbohydrate | 39.43±0.16 |
| Table 2: | Partial characterization result of the African locust bean | |||
| Parameter | Composition (%) |
| Saponification value | 183.73±1.00 |
| Peroxide value | 7.65±0.20 |
| Iodine value | 42.69±0.61 |
| Refractive index | 1.06±0.0005 |
| Acid value | 8.12±1.11 |
| Free fatty acid | 5.41±0.56 |
| Viscosity | 156.45±2.11 |
| Specific gravity | 0.93±1.36 |
| Cloud point (°C) | 10.43±0.15 |
| Flash point (°C) | 294±2.00 |
| Boiling point (°C) | 324.7±0.51 |
| Melting point (°C) | 6.47±0.31 |
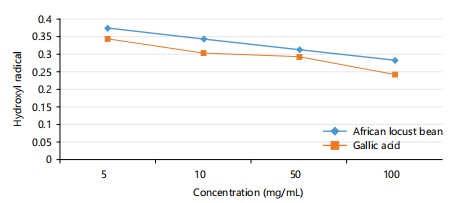
Hydroxyl radical: The graph in Fig. 2, shows the hydroxyl radical antioxidant activity of Parkia biglobosa is higher compared to the activity of the gallic acid. This shows the locust bean is a more potent antioxidant.
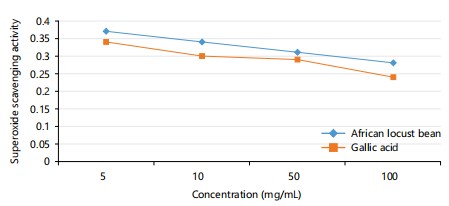
Super peroxide scavenging activity: The graph shows the super peroxide scavenging activity of Parkia biglobosa to be higher compared to the activity of the gallic acid in Fig. 3. This shows the locust bean is a more potent antioxidant.
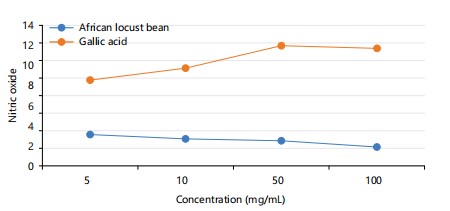
Nitric oxide: The graph shows the absorbance of nitric oxide in Parkia biglobosa and gallic acid at a particular concentration as seen in Fig. 4. The gallic acid has a higher concentration of nitric oxide than the locust bean.
Partial oil characterization: The result of the partial oil characterization assay carried out on the African locust bean in Table 2, shows that it had a higher saponification value compared to other values and also had a shorter fatty acid chain and low molecular weight. This proves it is a good soap-making oil.
|
|
|
| Table 3: | Macro minerals of African locust bean | |||
| Macro mineral (ppm) | Concentration |
| Magnesium | 0.166±0.005 |
| Sodium | 0.144±0.002 |
| Calcium | 7.10±0.01 |
| Potassium | 2.148±0.02 |
Minerals: The African oil bean as shown in Table 3, is very rich in macro and micro minerals. It contains a very high amount of Calcium compared to other macro minerals and iron compared to other micro minerals as seen in Table 4.
| Table 4: | Micro minerals of African locust bean | |||
| Micro mineral (ppm) | Concentration |
| Iron | 1.00±0.006 |
| Zinc | 0.253±0.008 |
| Selenium | 0.098±0.1 |
| Copper | 0.340±0.002 |
| Cobalt | 0.071±0.02 |
| Manganese | 0.117±0.116 |
| Table 5: | Vitamins present in the African locust bean | |||
| Vitamins | Values |
| Vitamin A | 13.69±0.10 |
| Vitamin C | 67.89±1.67 |
| Vitamin D | 7.34±0.13 |
| Vitamin B1 | 0.03±0.004 |
| Vitamin B2 | 0.16±0.001 |
| Vitamin B3 | 0.56±0.04 |
| Vitamin B12 | 3.39±0.10 |
| Folate | 0.25±0.006 |
Vitamins: The result in Table 5 shows that the African locust beans are rich in vitamins but have a higher constituent of Vitamin A and Vitamin C compared to the other vitamins present.
DISCUSSION
African locust bean is used in medicine in Africa and has been shown to have various health benefits. The seeds contain high levels of protein, fiber, and vitamins, and may help to reduce cholesterol levels and improve digestion. Additionally, the plant has been used to treat ailments such as diarrhea, dysentery, and bronchitis.
The result of the analysis (Table 1) showed that the African locust bean contains a high amount of carbohydrates (37%). A high carbohydrate content means that it contains a relatively large proportion of carbohydrates compared to other nutrients such as protein and fat and is a good source of energy. Parkia biglobosa contained 27% of crude fat. The high crude fat content contributes to their energy density. However, excessive consumption of high-fat African locust bean seeds can lead to health problems such as heart disease. The analysis also showed that the moisture content of the African locust bean seed in this study was found to be relatively high (7.5%) as compared to Olowokere et al.3 whose result showed a percentage of 5.1%. The high moisture concentration may be caused by the different varieties of seeds or by geographical factors, such as rainfall where the seeds are grown.
The analysis also showed that African locust bean seed had strong antioxidant activity, and may be effective in reducing oxidative stress and preventing various diseases associated with oxidative damage13. Komolafe et al.14 reported scavenging and reducing properties of 2,2azino-bis (3-ethylbenzothiazoline-6-sulfonic acid) by determining the amount of all antioxidant activity. The extract displayed superoxide scavenging activity and ABTS scavenging properties were significantly higher and dose-dependent than the corresponding standards.
However, it is important to note that excessive consumption of African locust beans can lead to adverse effects due to the presence of anti-nutritional factors15. Therefore, it should be consumed in moderation and with proper preparation techniques to minimize its anti-nutritional effects. Results of the anti-oxidant assay carried out are shown in Table 1. The analysis also showed that African oil beans were rich in both water and fat-soluble vitamins and minerals.
The results of the partial oil characterizations revealed that African locust bean seed contained higher acid value, iodine value, peroxide value, and free fatty acid except for saponification value and specific gravity in comparison with the analysis by Olowokere et al.3.
The study’s limitations include the need for further exploration of the bioavailability of nutrients and the impact of different processing methods on the nutritional composition of the African locust bean. Future research should focus on the potential applications of its oil in functional foods and sustainable agricultural practices.
CONCLUSION
African locust bean is a highly nutritious food that is rich in a variety of essential nutrients. It is a good source of protein, fiber, vitamins, and minerals, including all of the essential amino acids, vitamin C, iron, and calcium. The oil extracted from the seeds is also rich in antioxidants that can help to protect the oil from oxidation. The results revealed the nutritional composition of the African locust bean, including moisture, protein, fat, crude fiber, ash, and carbohydrate content. Additionally, the antioxidant activities and partial oil characterization were determined, highlighting significant values for saponification, peroxide, iodine, and other properties. The high unsaponifiable matter content of the oil suggests that it may have potential as a source of bioactive compounds. Overall, theAfrican locust bean is a valuable food source that can provide a range of health benefits when included as part of a balanced diet. It is recommended that the nutritional richness and potential for sustainable development be subject to further research, innovation, and conservation efforts.
SIGNIFICANCE STATEMENT
This research provides a comprehensive estimation of the nutritional value of the African locust bean. The findings underscore the bean’s potential as a nutrient-dense food source that could combat malnutrition and promote health in regions where it is consumed. Furthermore, understanding the nutritional profile of the African locust bean could lead to its increased utilization in the global food industry, contributing to food diversity and security. The study, has shown that theAfrican locust bean is a valuable food source that can provide a range of health benefits when included as part of a balanced diet. Therefore, has significant implications for nutrition science, public health, and sustainable food systems.
REFERENCES
- Lompo, D., B. Vinceti, H. Konrad, H. Gaisberger and T. Geburek, 2018. Phylogeography of African locust bean (Parkia biglobosa) reveals genetic divergence and spatially structured populations in West and Central Africa. J. Heredity, 109: 811-824.
- Nyadanu, D., R.A. Amoah, B. Obeng, A.O. Kwarteng, R. Akromah, L.M. Aboagye and H. Adu-Dapaah, 2017. Ethnobotany and analysis of food components of African locust bean (Parkia biglobosa (Jacq.) Benth.) in the transitional zone of Ghana: Implications for domestication, conservation and breeding of improved varieties. Genet. Resour. Crop E, 64: 1231-1240.
- Olowokere, J.A., A.I. Onen, M.C. Odineze, I.D. B'aga and J.N. Akoji, 2018. Extraction and characterization of oil from African locust bean (Parkia biglobosa) seed. Asian J. Appl. Chem. Res., 2.
- Guissou, A.W.D.B., C. Parkouda, B. Vinceti, E.M.A. Traoré and A.S. Dao et al., 2020. Variability of nutrients in Parkia biglobosa kernels from three geographical regions in Burkina Faso. Afr. J. Food Sci., 14: 63-70.
- Kolapo, A., O.E. Omopariola, A.O. Adeoye and A.J. Kolapo, 2020. Adoption of improved processing technology among African locust bean processors in South-West, Nigeria. Int. J. Agric. Res. Innovation Technol., 10: 123-128.
- Latimer Jr., G.W., 2023. Official Methods of Analysis of AOAC INTERNATIONAL. 22nd Edn., Oxford University Press, Gaithersburg, Maryland, USA, ISBN: 9780197610145.
- Yerima, B.I. and H.M. Adamu, 2011. Proximate chemical analysis of nutritive contents of Jujube (Ziziphus mauritiana) seeds. Int. J. Phys. Sci., 6: 8079-8082.
- Shirwaikar, A., K. Rajendran and R. Barik, 2006. Effect of aqueous bark extract of Garuga pinnata Roxb. in streptozotocin-nicotinamide induced type-II diabetes mellitus. J. Ethnopharmacol., 107: 285-290.
- Pavithra, K. and S. Vadivukkarasi, 2015. Evaluation of free radical scavenging activity of various extracts of leaves from Kedrostis foetidissima (Jacq.) Cogn. Food Sci. Hum. Wellness, 4: 42-46.
- Green, L.C., D.A. Wagner, J. Glogowski, P.L. Skipper, J.S. Wishnok and S.R. Tannenbaum, 1982. Analysis of nitrate, nitrite, and [15N]nitrate in biological fluids. Anal. Biochem., 126: 131-138.
- Kunchandy, E. and M.N.A. Rao, 1990. Oxygen radical scavenging activity of curcumin. Int. J. Pharm., 58: 237-240.
- Thakur, A., S. Singh, K. Dulta, N. Singh and B. Ali et al., 2022. Nutritional evaluation, phytochemical makeup, antibacterial and antioxidant properties of wild plants utilized as food by the Gaddis-A tribal tribe in the Western Himalayas. Front. Agron., 4.
- Barrera, G., 2012. Oxidative stress and lipid peroxidation products in cancer progression and therapy. Int. Scholarly Res. Netw., 2012.
- Komolafe, K., A.C. Akinmoladun, T.R. Komolafe, M.T. Olaleye, A.A. Akindahunsi and J.B.T. Rocha, 2017. African locust bean (Parkia biglobosa, Jacq Benth) leaf extract affects mitochondrial redox chemistry and inhibits angiotensin-converting enzyme in vitro. Clin. Phytosci., 3.
- Oktay, M., İ. Gülçin and Ö.İ. Küfrevioğlu, 2003. Determination of in vitro antioxidant activity of fennel (Foeniculum vulgare) seed extracts. LWT Food Sci. Technol., 36: 263-271.
How to Cite this paper?
APA-7 Style
Enoch,
O.C., Chigozie,
L.I., Nwangwu,
S.C., Ibeabuchi,
C.G., Ikechukwu,
U.K., Ogochukwu,
A.R., Chukwuebuka,
E.V., Victoria,
A.I., Oruaro,
A.F. (2025). Estimation of the Nutritional Values of African Locust Bean Parkia biglobosa. Scientific Asia, 1(1), 1-15. https://doi.org/10.3923/sa.2025.01.15
ACS Style
Enoch,
O.C.; Chigozie,
L.I.; Nwangwu,
S.C.; Ibeabuchi,
C.G.; Ikechukwu,
U.K.; Ogochukwu,
A.R.; Chukwuebuka,
E.V.; Victoria,
A.I.; Oruaro,
A.F. Estimation of the Nutritional Values of African Locust Bean Parkia biglobosa. Scientific Asia 2025, 1, 1-15. https://doi.org/10.3923/sa.2025.01.15
AMA Style
Enoch
OC, Chigozie
LI, Nwangwu
SC, Ibeabuchi
CG, Ikechukwu
UK, Ogochukwu
AR, Chukwuebuka
EV, Victoria
AI, Oruaro
AF. Estimation of the Nutritional Values of African Locust Bean Parkia biglobosa. Scientific Asia. 2025; 1(1): 1-15. https://doi.org/10.3923/sa.2025.01.15
Chicago/Turabian Style
Enoch, Oguazu, Chinenye, Lilian Isioma Chigozie, Spencer Chukwumaobim Nwangwu, Chinwe Gloria Ibeabuchi, Ubaoji Kingsley Ikechukwu, Anyanwu Reginald Ogochukwu, Ezeanyanwu Valentine Chukwuebuka, Anyaoha Ihedinachi Victoria, and Ajakpofo Firstina Oruaro.
2025. "Estimation of the Nutritional Values of African Locust Bean Parkia biglobosa" Scientific Asia 1, no. 1: 1-15. https://doi.org/10.3923/sa.2025.01.15

This work is licensed under a Creative Commons Attribution 4.0 International License.